The Functional safety plays a central role in the development of safety-critical systems. Diagnostic Coverage (DC) is an essential metric in this regard. It describes the ratio of detected hazardous failures to the total number of all hazardous failures and significantly influences the achievable safety level. This is particularly true in the standards DIN EN ISO 13849-1 and IEC 61508 is the DC value used as a criterion for evaluating the safety of control systems.
Content
Diagnostic Coverage and Safe Failure Fraction (SFF)
There are two different metrics for evaluating diagnostic coverage:
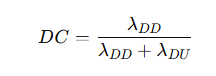
Diagnostic Coverage Ratio of detected dangerous failures to total dangerous failures:
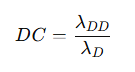
whereby
- lambdaD = Overall failure rate for dangerous errors
- lambdaDD Recognizably dangerous failures (Dangerous Detected)
Safe Failure Fraction Additionally, consider safe failures:
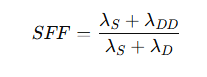
where λs for safe failures.
A possible connection between DC and SFF arises if we assume, for example, that 50 % failures are safe and 50 % failures are dangerous:
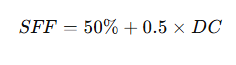
Example: If DC = 90 %, the SFF is approximately 95 %.
Calculation of the DC value
The DC value can be calculated at different levels – at the component level, for a specific block, or for the entire safety-related parts of the control system (SRP/CS). There are two common methods for this:
Calculation of the failure rate (λ)
The DC value is calculated in detail by determining the failure rates of individual components. Three types of failures are considered here:
- Total failure rate
- Recognizable failure ratedangerous detectable)
- An unrecognizable failure rate (Dangerous and undetectable.)
The formula for calculating the diagnostic coverage rate, considering both detectable and undetectable failure rates, is:
This method requires a detailed Failure Mode and Effects Analysis (FMEA) to determine the individual values for each component.
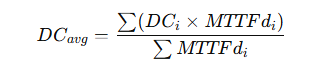
Approximate calculation by estimation
A simplified method for determining the DC value is based on a conservative estimate, which is frequently used in practice. In this method, the DC values of individual components are weighted with their MTTFd (Mean Time To Dangerous Failure) values and averaged:
The calculated DC values are divided into four classes:
| DC-Class | DC value in % | Meaning |
|---|---|---|
| No diagnosis | DC < 60 % | Low or no diagnostic capability |
| Low | 60 % ≤ DC < 90 % | Limited diagnostic measures |
| Middle | 90 % ≤ DC < 99 % | Effective diagnostic measures |
| High | DC ≥ 99 % | Very high diagnostic certainty |
The ISO 13849-1 The definition of diagnostic coverage explicitly permits the use of estimates, provided they are based on verifiable technical assumptions and established empirical values. In practice, this means that a precisely calculated error detection rate is not required for every single measure. Instead, typical, normatively accepted ranges such as „low,“ „medium,“ or „high,“ as well as reference values (e.g., 90 % or 99 %), may be used if the underlying diagnostic measure and its effectiveness are sufficiently understood. The following table shows examples of measures along the functional chain (input, logic, output) and assigns typical diagnostic coverage levels to them, as used in practice and in the standard environment.
| Category | Exemplary measure | Maximum Diagnostic Coverage (DC) |
|---|---|---|
| Sensors / Input Units | Process fault detection via sensors (dependent on request rate) | 60% – 90% |
| Cyclic test pulse by changing input signals | 90 % | |
| Plausibility check, e.g., positively driven relay contacts | 99 % | |
| Logic | Dynamic principles (e.g., interlocking circuits in relay systems, ON-OFF-ON requirements) | 99 % |
| Test of Watchdog reaction capability via main channel | 90 % | |
| Actuators / Output Units | Redundant shutdown circuit with monitoring | 90% |
| Direct monitoring, e.g., control valves or electromechanical units with forced guidance | 99 % | |
| Mechanical measures | Switches with positively driven contacts for plausibility check | 99 % |
Summary
The diagnostic coverage (DC) is a central metric for functional safety, as it indicates how many dangerous failures can be detected. SFF extends this concept by also considering safe failures, with the relationship between DC and SFF being merely illustrative. High diagnostic coverage reduces the probability of dangerous failures and contributes to the safety of control systems. The calculation can be performed either through detailed FMEA analyses or through approximation methods. Whether diagnostics or redundancy are preferred depends on the architecture and safety-related requirements. By combining failure modeling, redundancy, and diagnostic techniques, a high level of safety can be achieved without introducing unnecessary complexity into the system.